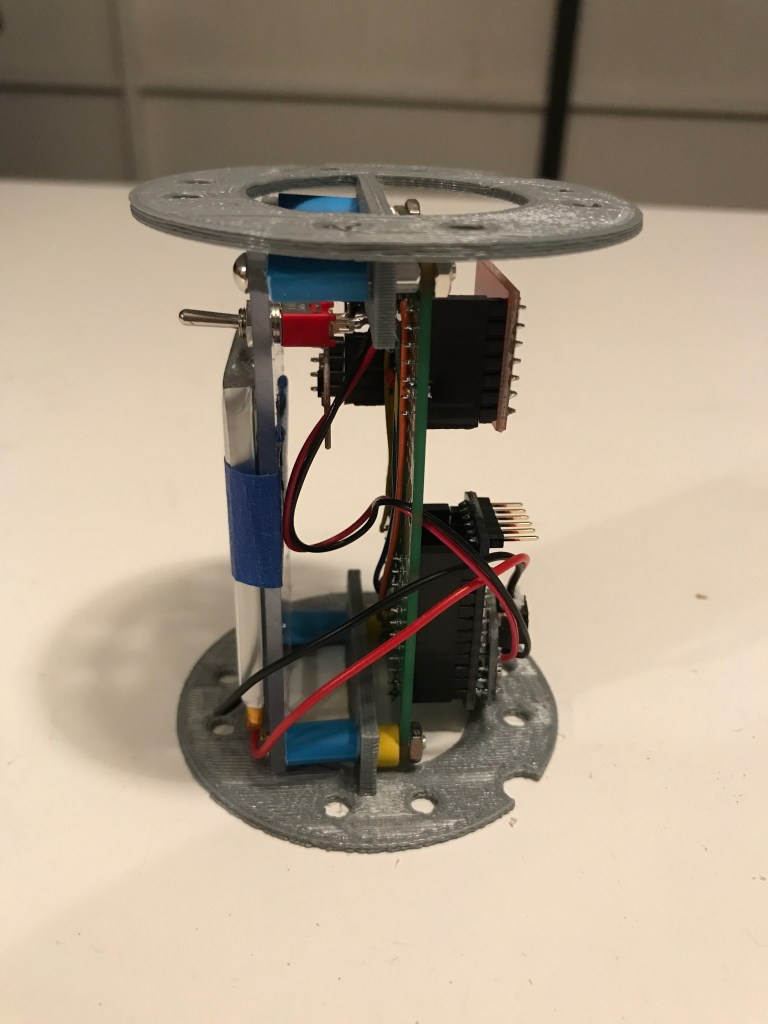
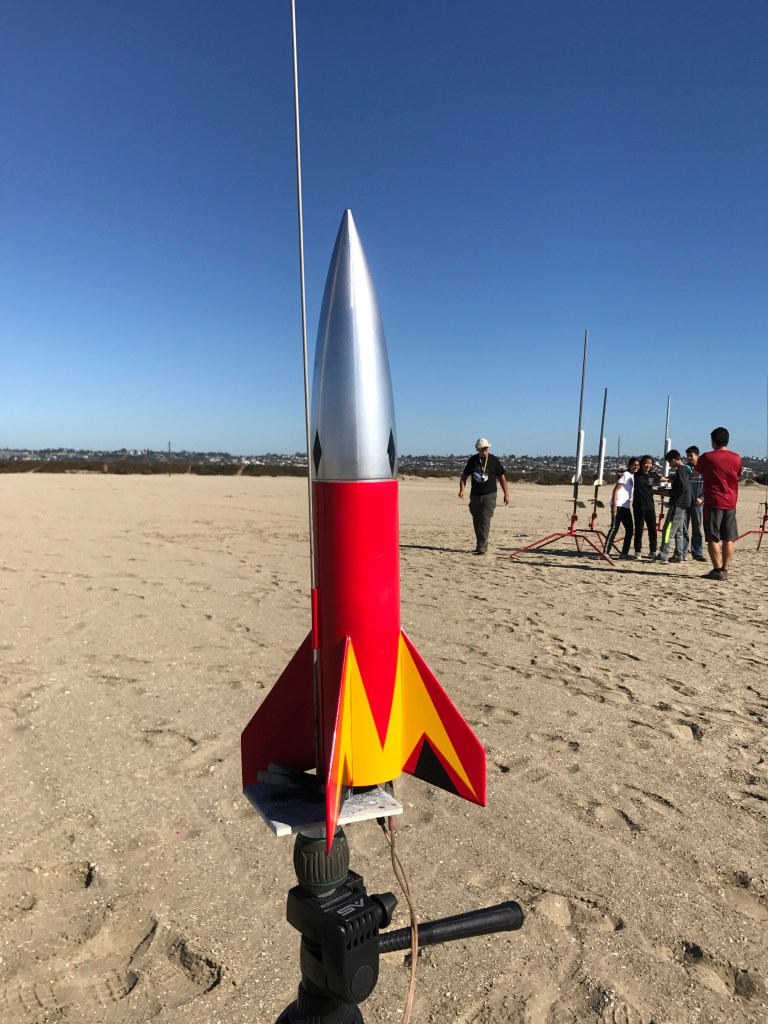
Several years ago I built Sonoma State University’s Rising Data flight recorder designed to fit inside a modified Estes Big Daddy rocket. I have successful flown it in the Big Daddy and larger rockets. Most recently it flew in the payload of a High Altitude Balloon. Details can be found at: https://fredricraab.wordpress.com/scienceheads-org-hab-6-balloon-flight/
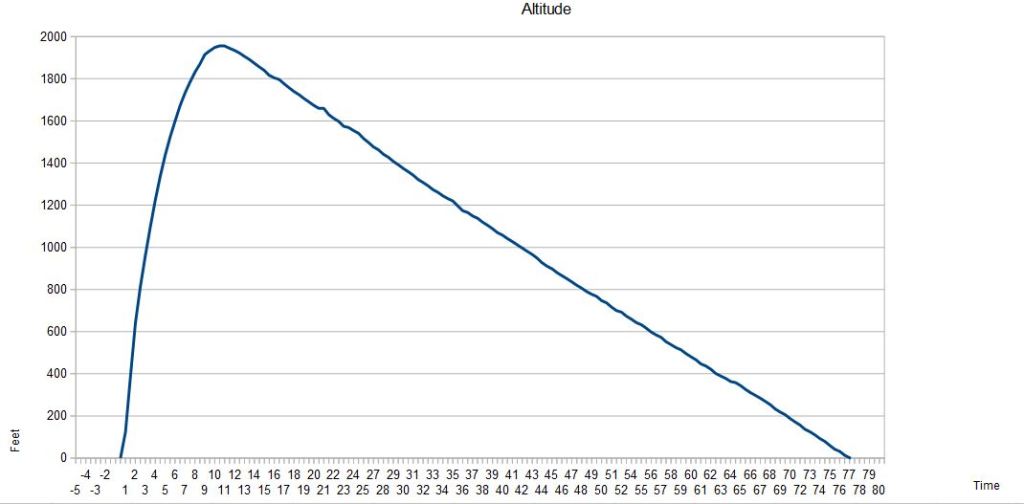
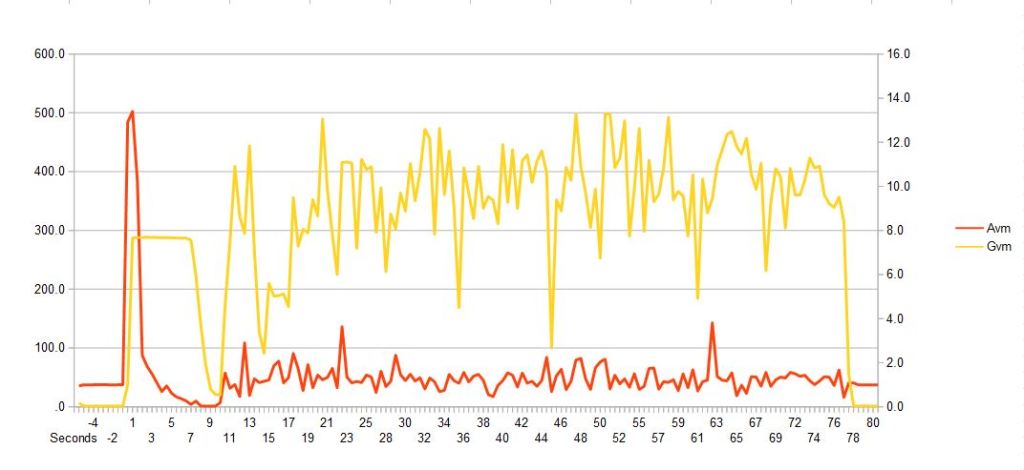
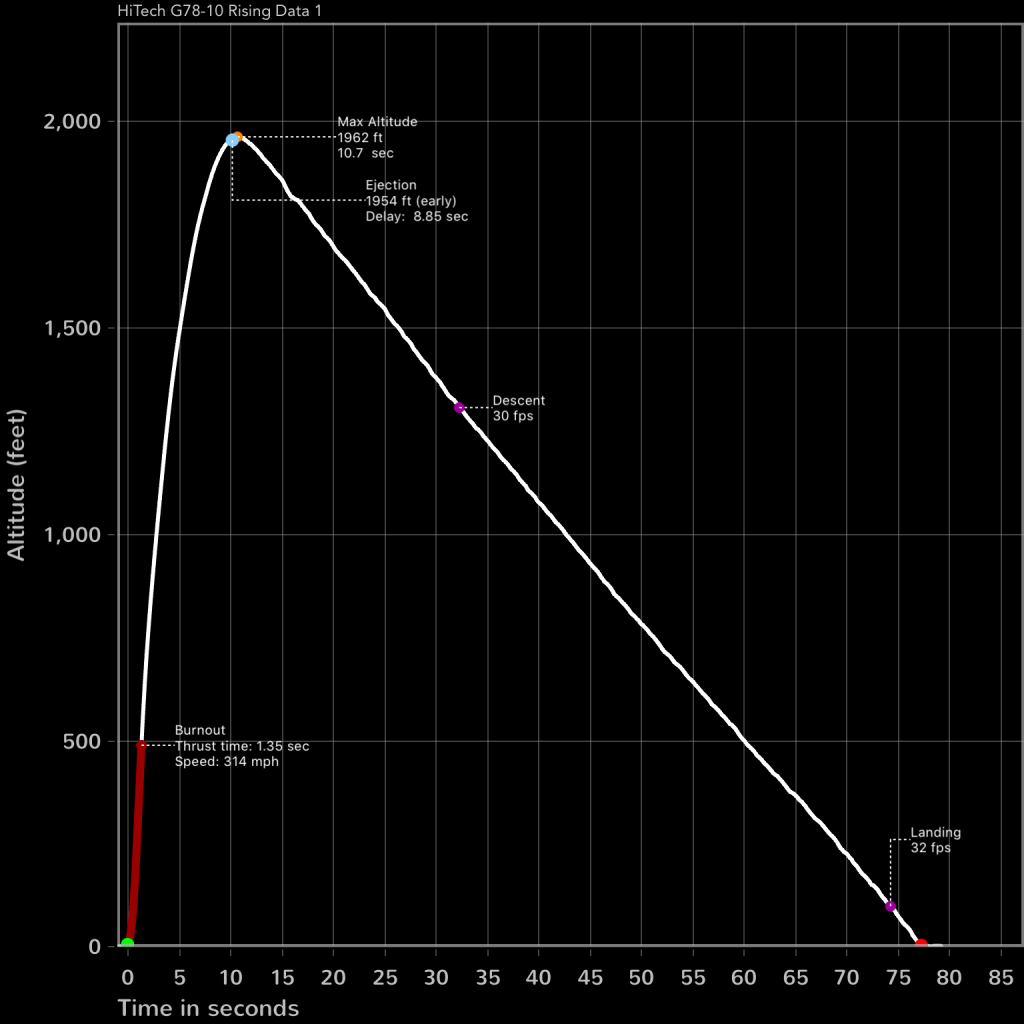
Below are two Excel plots of the data recorded by Rising Data on a typical flight. The blue line is altitude, red line is accelerometer and yellow line is gyroscope, plotted against time in seconds. The rocket also contained a Jolly Logic Altimeter 3. Their sophisticated software detects several key events from the altimeter and accelerometer data which it summarizes in the large graphic shown below.
It is interesting to compare and interpret the graphs. The rocket engine burns for only 1.35 seconds, showing maximum acceleration data as indicated by the red line. Also notice the sharp rise in the gyro data (yellow line). As the rocket coasts to its maximum altitude, the accelerometer data drops to zero and the gyro data is flat. Once the parachute fully deploys at 11 seconds, the smooth descent begins. The accelerometer data is fairly constant, but the gyro data indicates the rocket is spinning around violently on the single parachute (as is typical). After the rocket lands at 77 seconds, all data parameters remain flat.
 Fredric Raab